

Market conditions are rarely as clean as technical textbooks suggest. As of August 13, 2026, Curve DAO crypto finds itself balanced on a knife edge between constructive chart structure and deteriorating protocol fundamentals — a split that demands traders read both sides of the tape.
Key takeaways
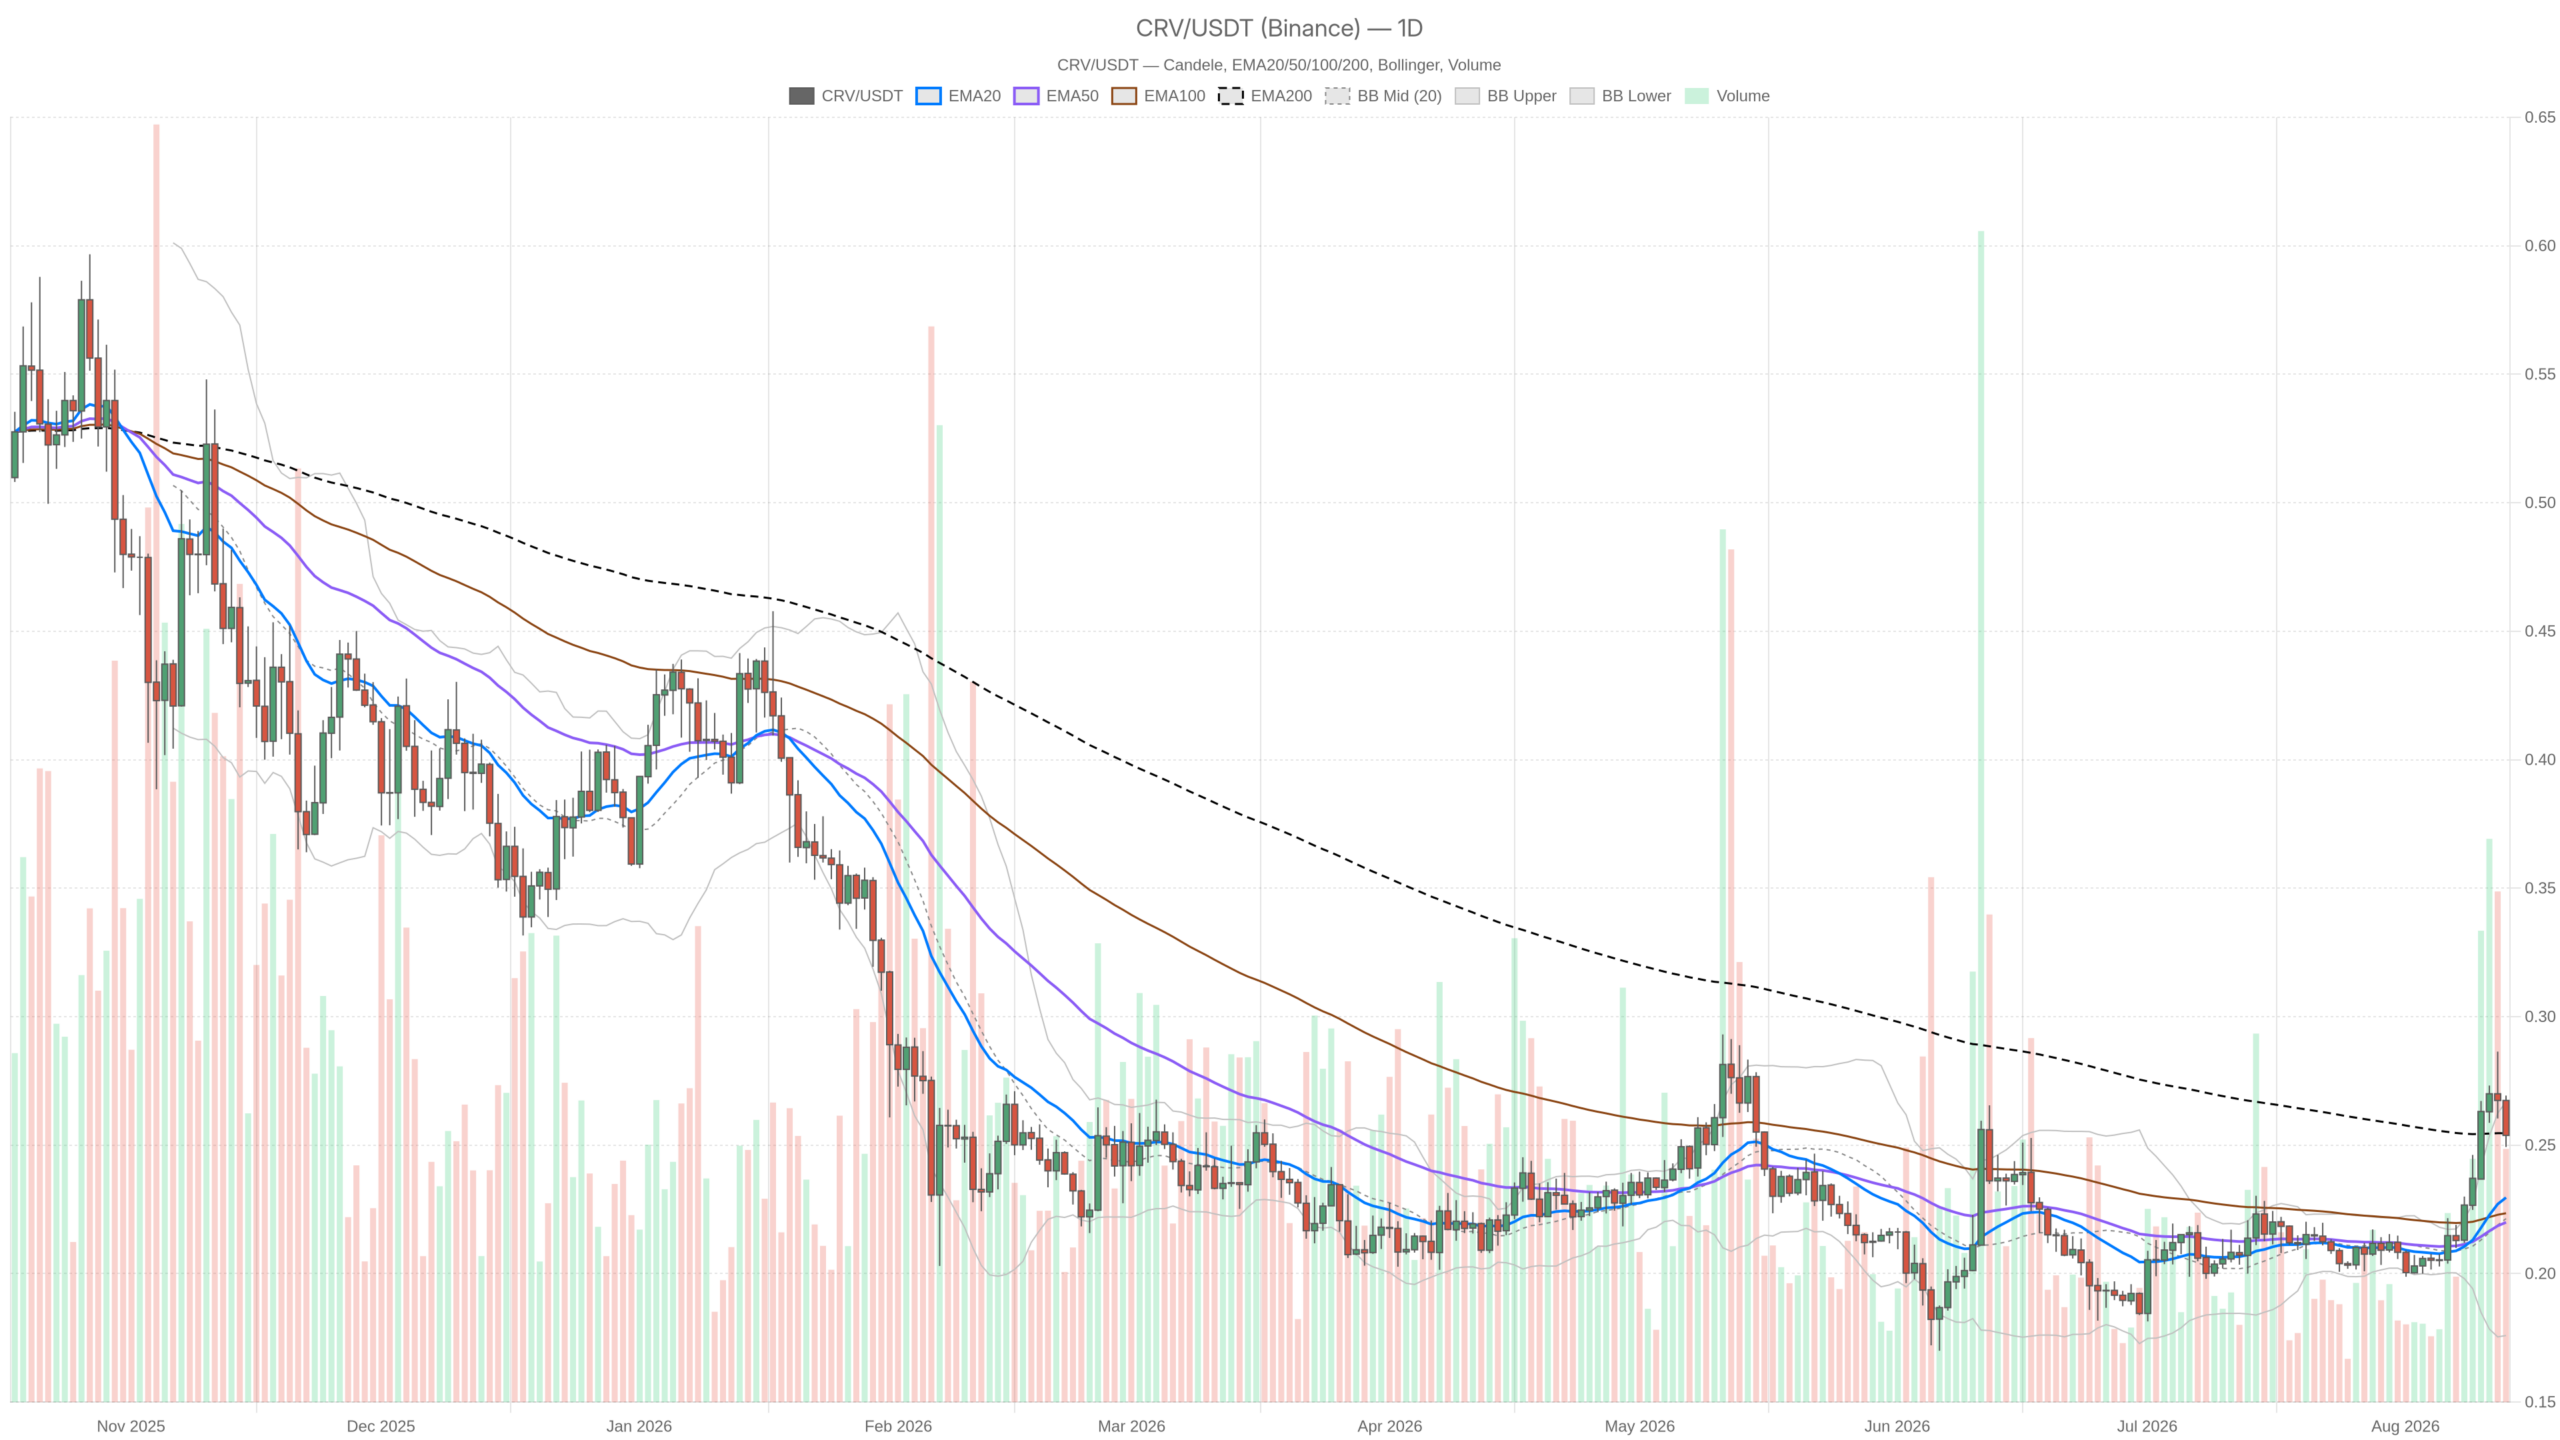
- CRVUSDT trades at 0.25 on the daily chart, pinned directly against its 200-period EMA — a make-or-break level for the long-term structure.
- Daily RSI14 reads 66.28 with a positive MACD histogram, but 1H momentum has cooled to 39.91, creating a timeframe conflict.
- Curve DEX fees have collapsed: down 38.54% in 24 hours, 65.68% over 7 days, and 73.5% over 30 days — far steeper than rival DEXs.
- The Fear & Greed Index sits at 29 while Bitcoin dominance holds at 56.33%, offering little macro tailwind for altcoin breakouts.
- The daily pivot at 0.26 and S1 at 0.25 define the immediate decision zone; neither bulls nor bears have a confirmed edge yet.
Trend continuation or exhaustion at resistance?
The central question for CRVUSDT right now is whether the daily uptrend can absorb the 200 EMA or whether exhaustion sets in at this critical level. Price trades above both the 20-period EMA at 0.23 and the 50-period EMA at 0.22 — the classic signature of a steady climb. However, sitting almost exactly on the 200-period EMA at 0.25 introduces genuine tension. A clean break and hold above the 200 EMA would confirm that the longer-term structure has flipped bullish. Failure here, on the other hand, risks dragging $CRV back into the range it has been fighting for months. The system’s own regime tag for the daily reads neutral despite momentum indicators leaning bullish, signaling that the move has not yet fully committed.
Daily timeframe: the macro bias
RSI14 on the daily stands at 66.28 — firmly bullish but creeping close to overbought territory. This suggests buyers have been pushing hard, and the move may be due for a pause or shakeout before extending further. MACD prints a positive histogram at 0.01 with the line above the signal, confirming that the recent push carries real momentum rather than being a one-candle fluke. The EMA stack — 20 above 50, with price hugging the 200 — paints a market that has recovered from a longer downtrend and is now testing whether it can flip the long-term average into support.
Bollinger Bands reinforce the expansion picture: the mid-band sits at 0.22, the upper band at 0.27, and price at 0.25 positions comfortably above the midline and pressing toward the top of the range. ATR14 at 0.01 is low relative to price, meaning the recent advance has been a controlled grind rather than a volatile spike. Pivot levels tighten the story further — the daily pivot point rests at 0.26, with R1 at 0.27 and S1 at 0.25. Price is parked essentially on S1, just below the pivot, meaning the immediate battle centers on whether $CRV can reclaim 0.26 and open the door to 0.27, or whether it slips back and treats 0.25 as a floor that eventually breaks.
1H timeframe: confirmation or contradiction?
This is where the daily bullish read gets complicated. On the 1H chart, RSI14 has dropped to 39.91 — below the midpoint and leaning toward bearish short-term momentum. MACD is flat across the line, signal, and histogram, all sitting at zero, which tells you there is no real directional push happening on this timeframe. It is a pause, not a trend. The EMA structure on 1H shows the 20 and 50 both at 0.26, sitting above the 200 at 0.24, with price at 0.25 trading below the short-term EMAs but above the 200. That is the fingerprint of a pullback inside a still-intact bigger structure — not necessarily a reversal.
Bollinger Bands are tight, with the mid-band at 0.26, the upper at 0.27, and the lower at 0.25. Price hovers near the lower band, signaling short-term selling pressure testing the floor of a very narrow range. The 1H pivot levels are essentially flat — pivot point, R1, and S1 all around 0.25 — confirming there is no clear directional edge on this timeframe. It is a holding pattern, and traders should treat it as such rather than reaching for a thesis that is not yet there.
15-minute execution context
Zooming into the 15m chart, RSI14 reads 48.47 — dead neutral. MACD is flat again, and the EMA stack, with the 20 at 0.25 below both the 50 and 200 at 0.26, shows price sitting under a cluster of short-term resistance. This is not a timeframe to build a directional thesis on. It simply confirms that $CRV is consolidating without conviction either way. For anyone looking to time an entry, this is the noise zone — wait for the 1H to show a clearer break before treating 15m signals as anything more than execution timing.
The fee problem: a fundamental headwind
Here is where the picture gets genuinely more cautious. According to DefiLlama-style fee data, Curve DEX fees have fallen sharply across every recent window: down 38.54% in the last 24 hours, down 65.68% over 7 days, and down 73.5% over 30 days. That represents a steep and consistent decline in protocol activity, and it stands in real contrast to the daily chart’s bullish momentum reading. Rival DEXs like Uniswap V3 and Fluid DEX have also seen fee softness, but nothing as pronounced as Curve’s 30-day drop. When the underlying protocol generating revenue for Curve DAO crypto is seeing usage fall this fast, it raises a fair question about whether the price action is being driven by genuine demand or just short-term positioning ahead of a broader market move.
Bullish scenario
If $CRV can close daily candles above the 200 EMA at 0.25 and clear the daily pivot at 0.26, the path toward R1 at 0.27 and the upper Bollinger Band opens up. A recovery in 1H RSI back above 50, paired with MACD turning positive on that timeframe, would confirm buyers are stepping back in rather than daily momentum coasting on its own. This scenario gets invalidated quickly if price fails to hold above 0.25 support — a break below that level, especially with rising volume, would flip the structure back toward mean reversion into the 0.22 mid-band zone.