
Bitcoin remains trapped in a low-momentum environment, with price action increasingly characterized by choppy consolidation rather than a decisive directional move. The lack of liquidity and volume continues to limit follow-through, while the current structure leaves room for another liquidity-driven move before a stronger trend develops.
Bitcoin Price Analysis: The Daily Chart
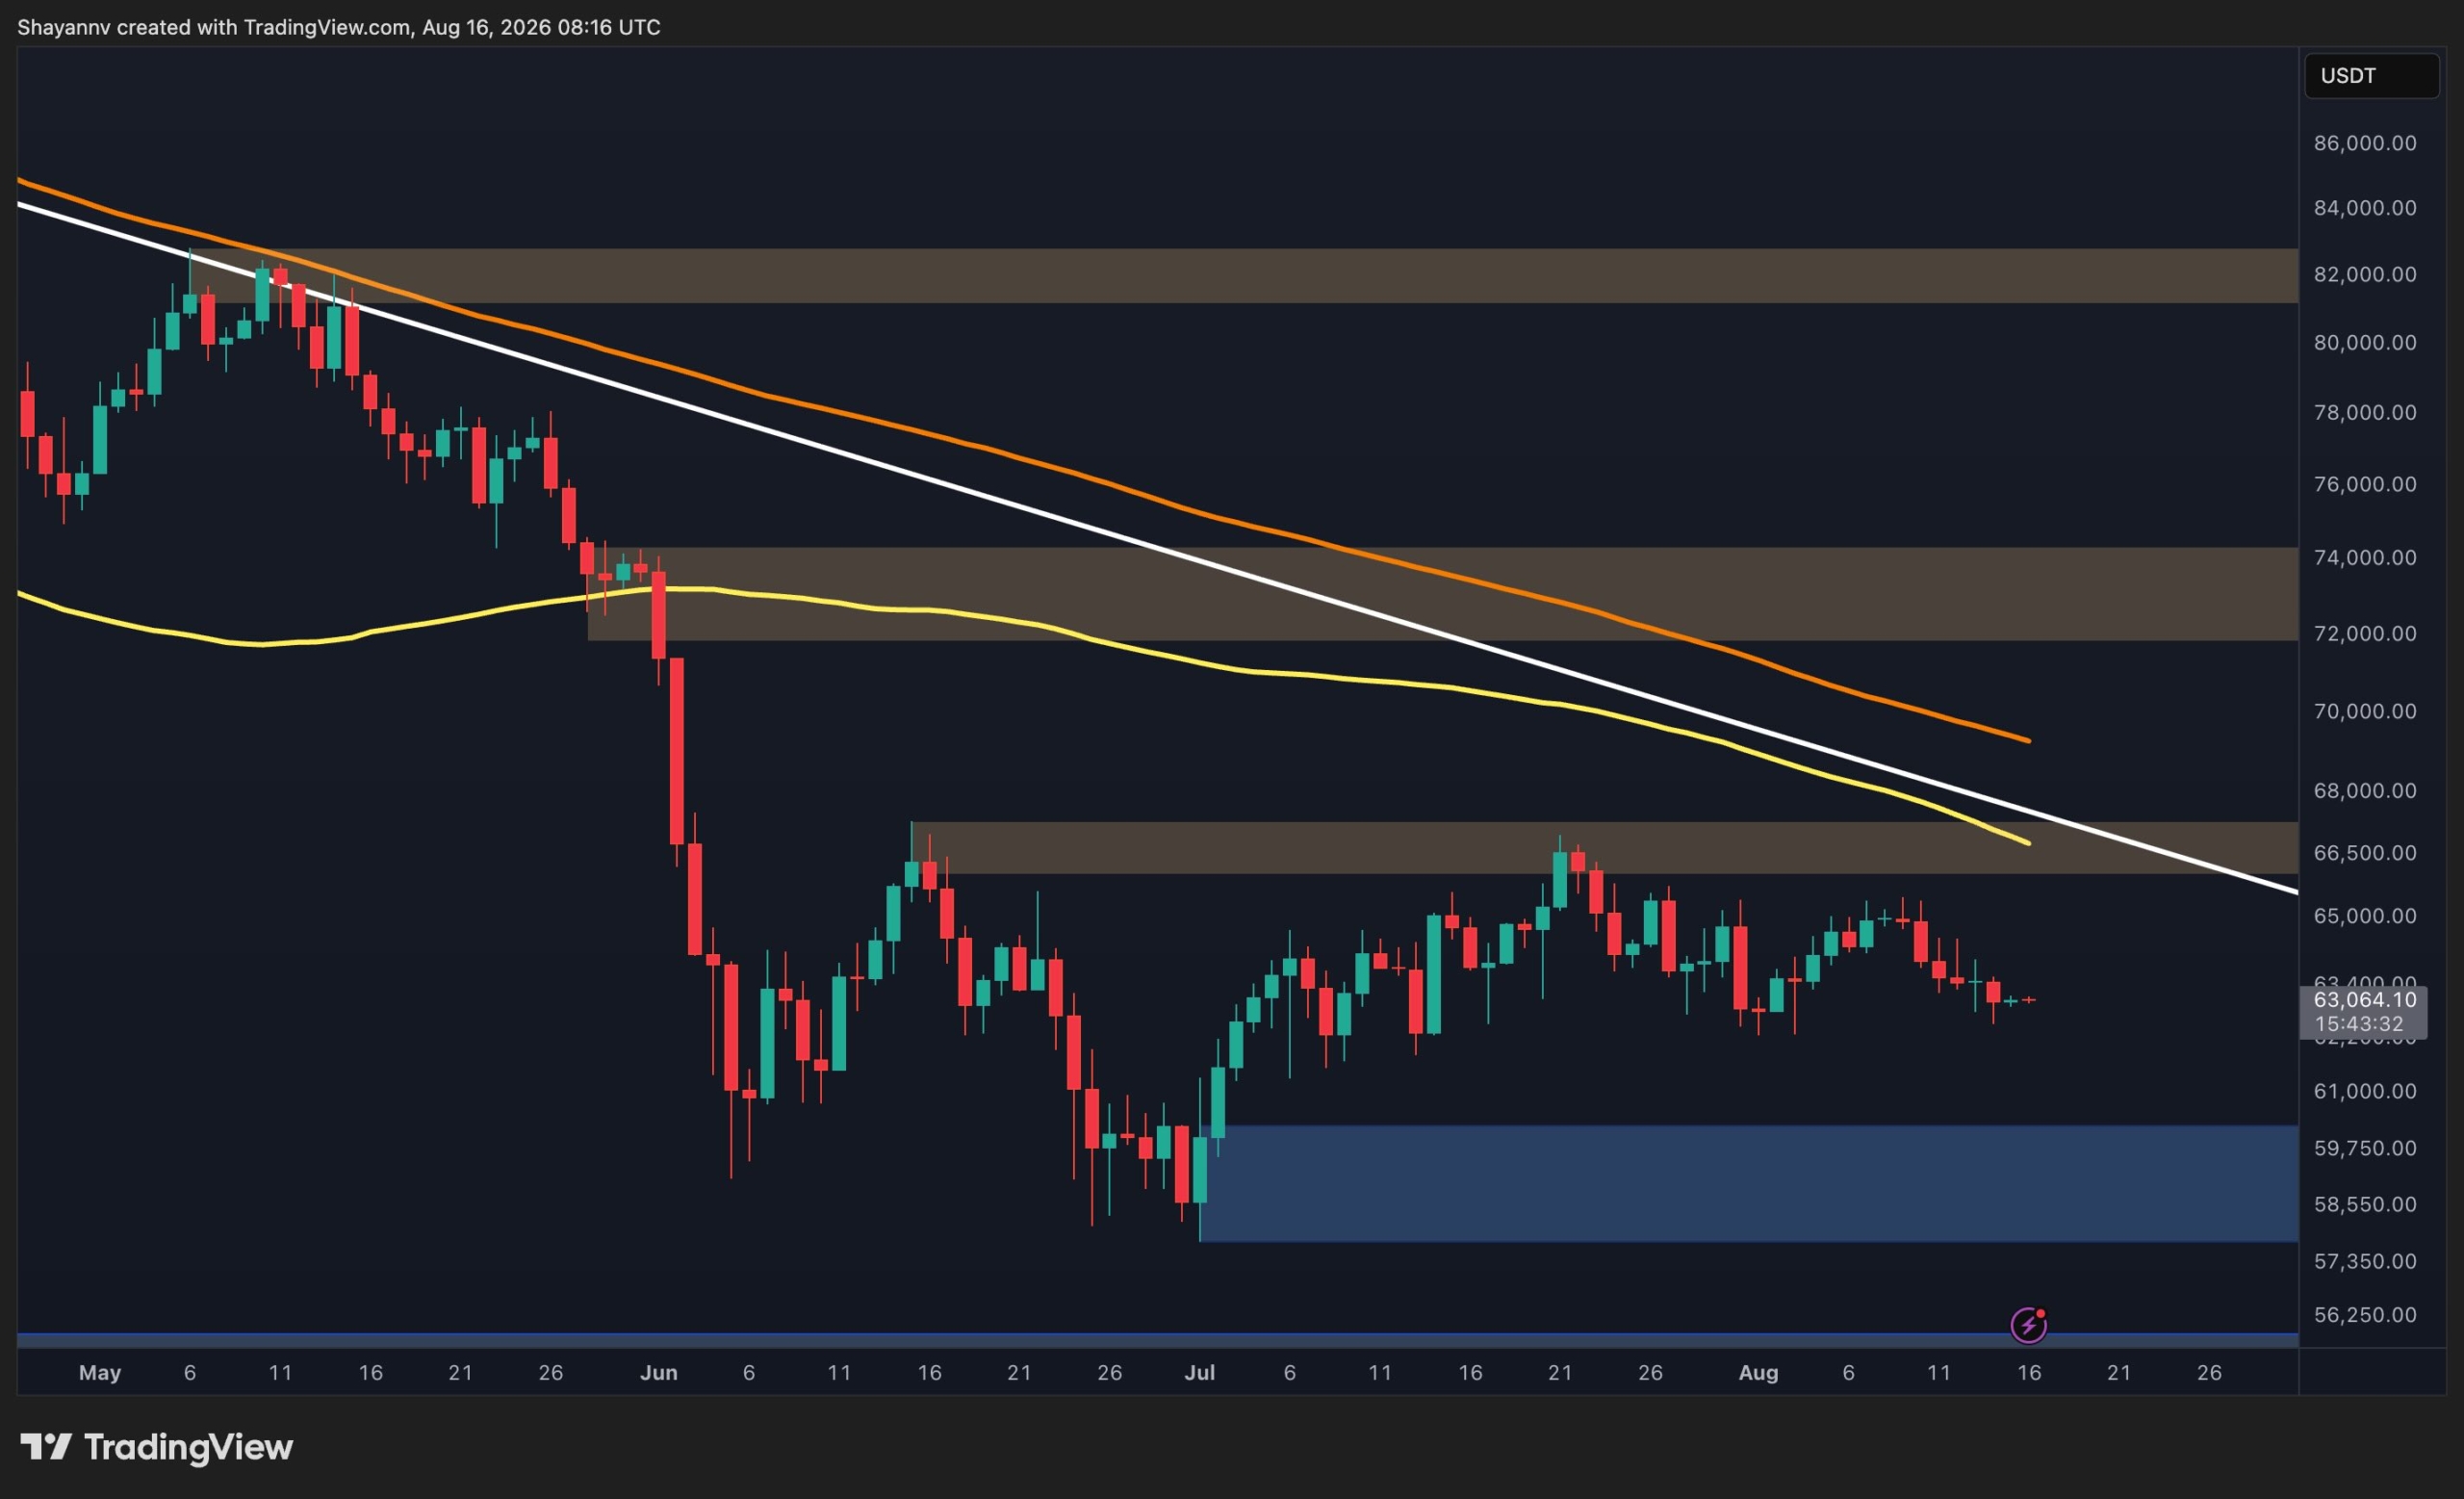
On the daily timeframe, BTC is still moving sideways after the sharp correction from the $66K area. The broader structure remains compressed, with the price currently around $63K and trading well below the major descending moving averages. The 100-day MA is still acting as an important overhead reference, while the declining white trendline reinforces the broader resistance structure.
The main scenario remains a lack of momentum. With market liquidity and volume appearing limited, the asset has been unable to establish a sustained breakout in either direction, resulting in a prolonged and choppy sideways phase. The first significant resistance is located around $66.2K-$67.2K, where the horizontal supply zone and descending trendline converge.
On the downside, the $58.5K-$59.8K region remains the most important major demand area visible on the chart. A deeper move into this zone would not necessarily invalidate the broader recovery structure, but a decisive breakdown below it would significantly weaken the bullish case.
For now, the absence of volume and momentum favors continued consolidation rather than an immediate breakout.