

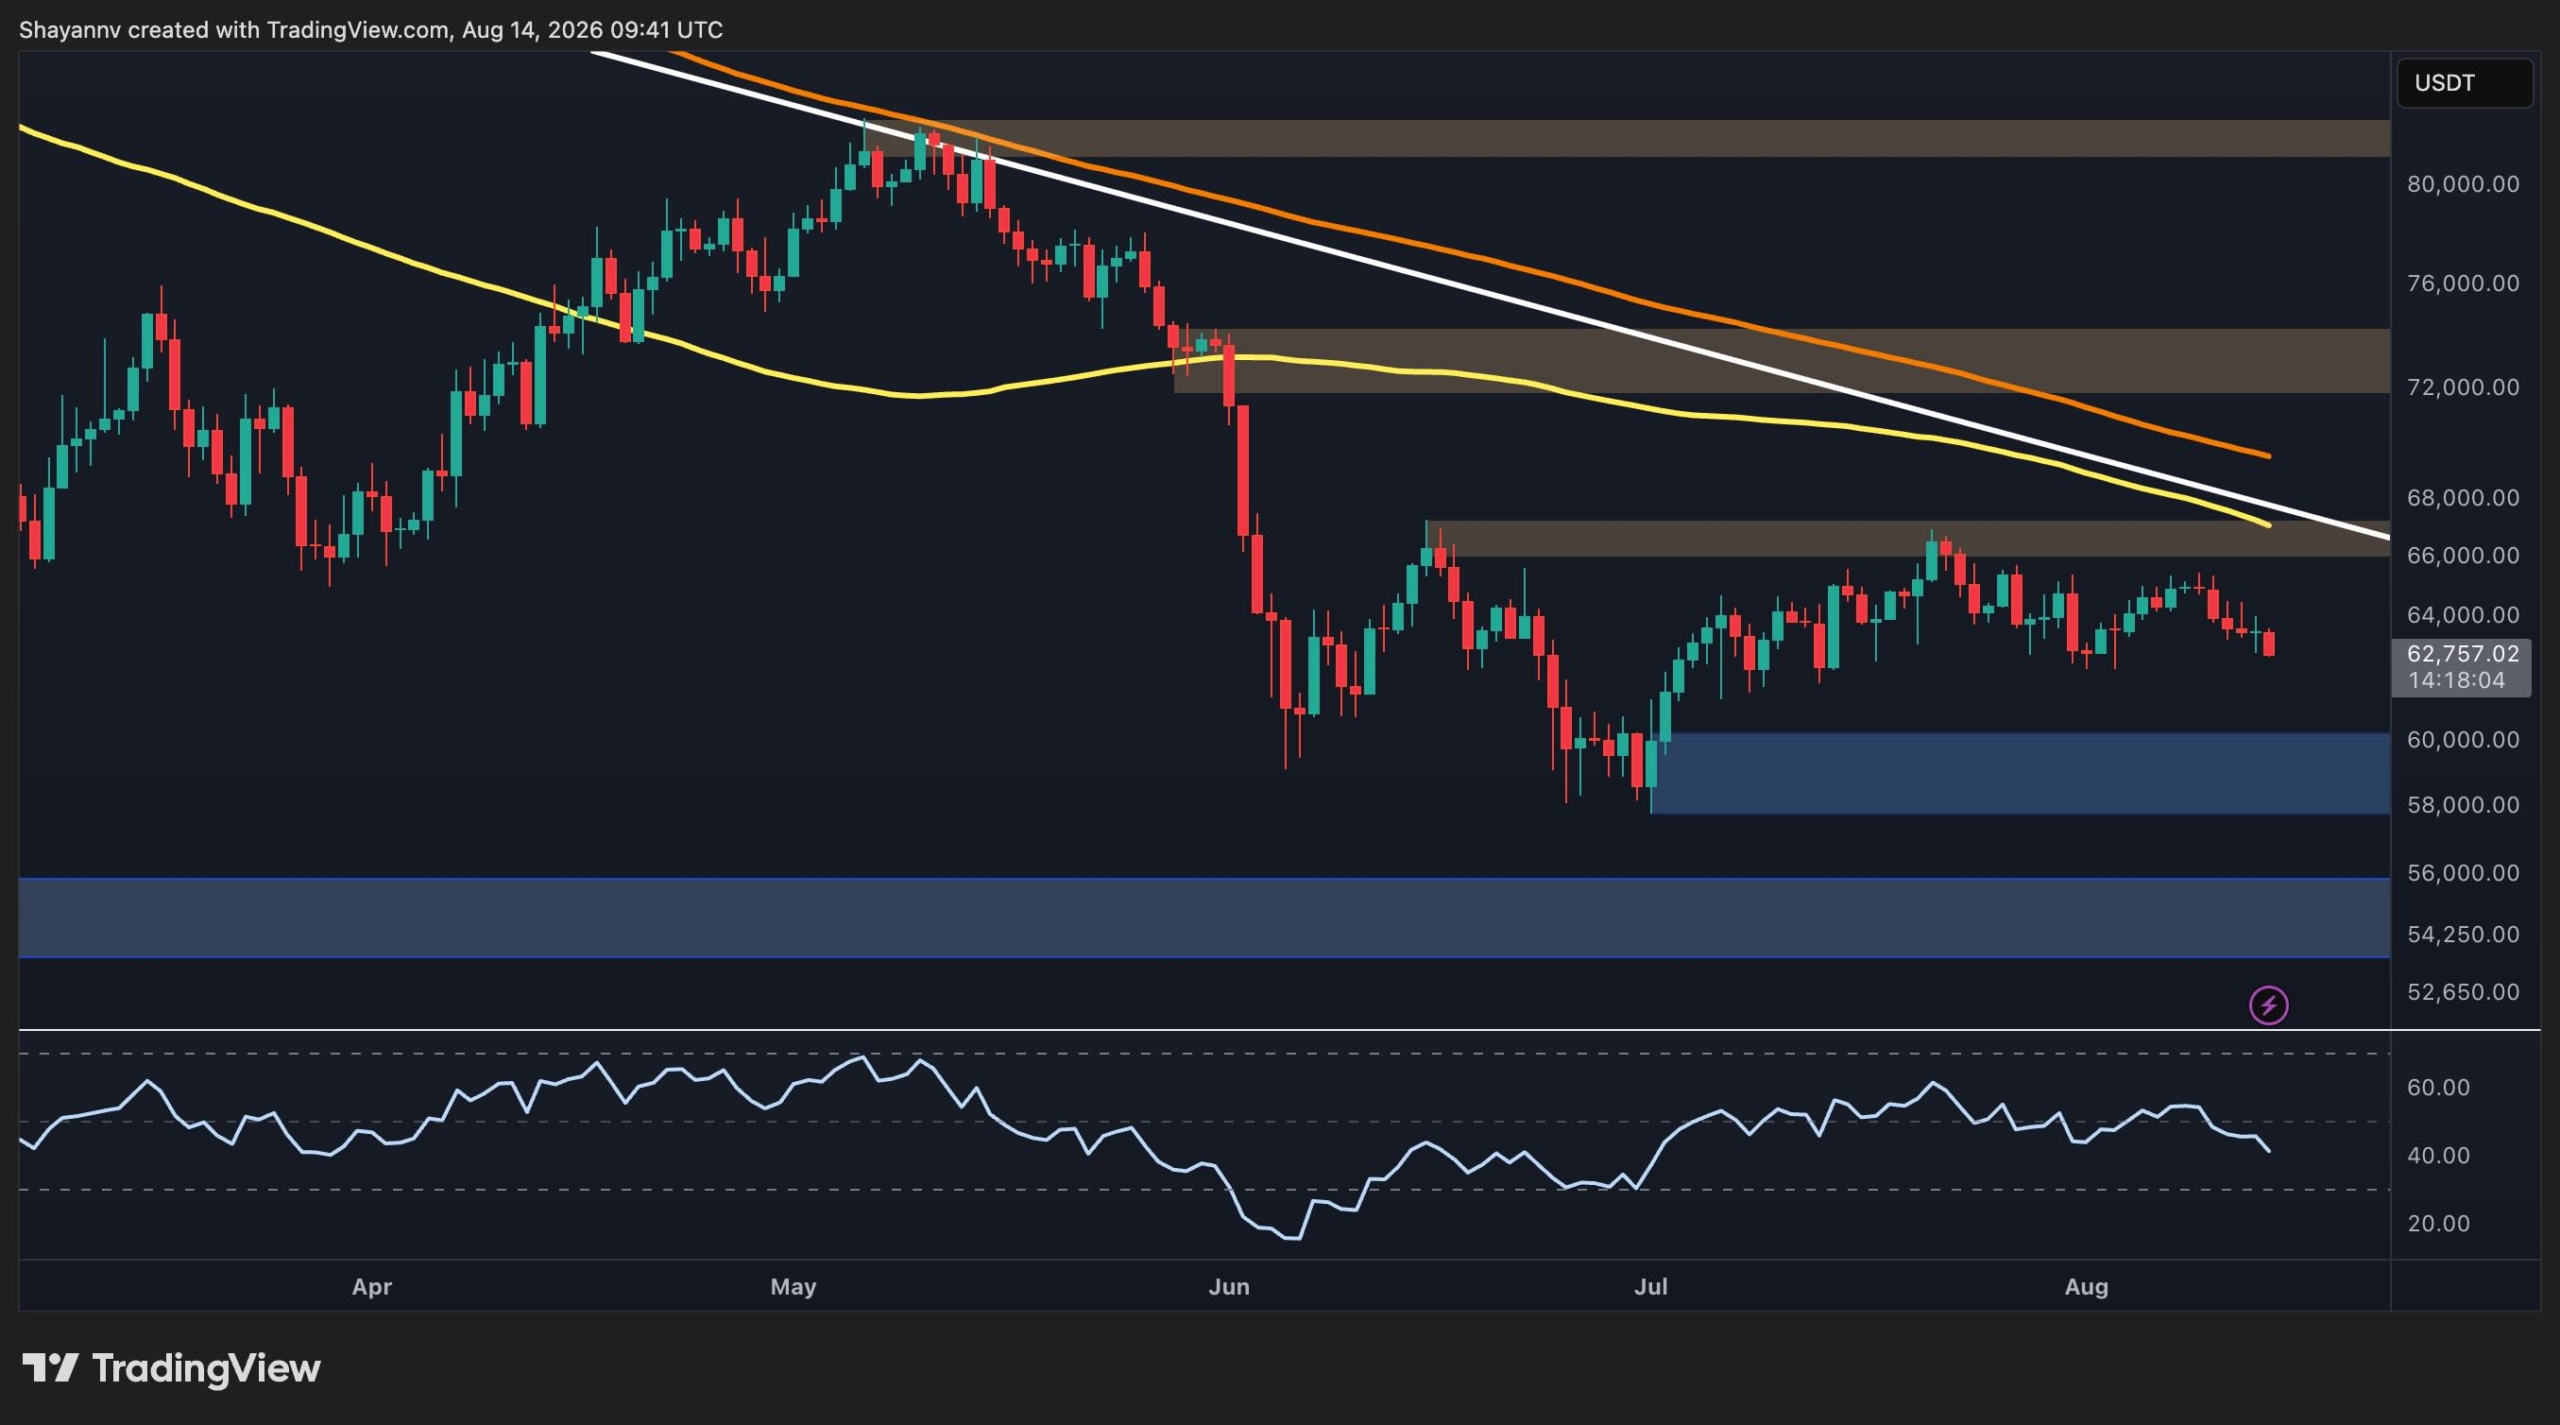
Bitcoin is testing a critical support area after failing to break above the descending resistance structure that has capped the price for months. With BTC trading around $62.7K, the market is approaching a key decision point, while the elevated Exchange Whale Ratio adds a potentially bearish on-chain signal to the technical picture.
Bitcoin Price Analysis: The Daily Chart
The daily chart shows that Bitcoin remains within a broader corrective structure. After recovering from the June low near $58K, BTC established a series of higher lows and climbed toward the $66K resistance zone. However, the recovery has so far failed to produce a decisive breakout, and price has recently turned lower.
The most important resistance is currently around $66K-$67K, where the descending trendline, the horizontal supply zone, and the broader moving-average structure converge. A daily close above this area would represent a meaningful improvement in market structure and could open the way toward the $72K-$74K zone. Beyond that, the $80K-$82K region remains a major higher-timeframe resistance area.
On the downside, BTC is approaching the $60K support zone once again. This area will most likely attract buyers and is therefore important for maintaining the recent recovery structure. A decisive daily breakdown of this zone would increase the probability of a move below the $58K low and toward the next major support visible on the chart around $55K.
Momentum is also not particularly encouraging at the moment. The daily RSI is around the mid-40s and has turned lower, indicating that bullish momentum has weakened without yet reaching deeply oversold conditions. Meanwhile, BTC remains below the major moving averages, which continue to slope downward. As a result, the broader daily structure remains cautious to bearish until the $66K-$67K area is reclaimed.